Semua Proyek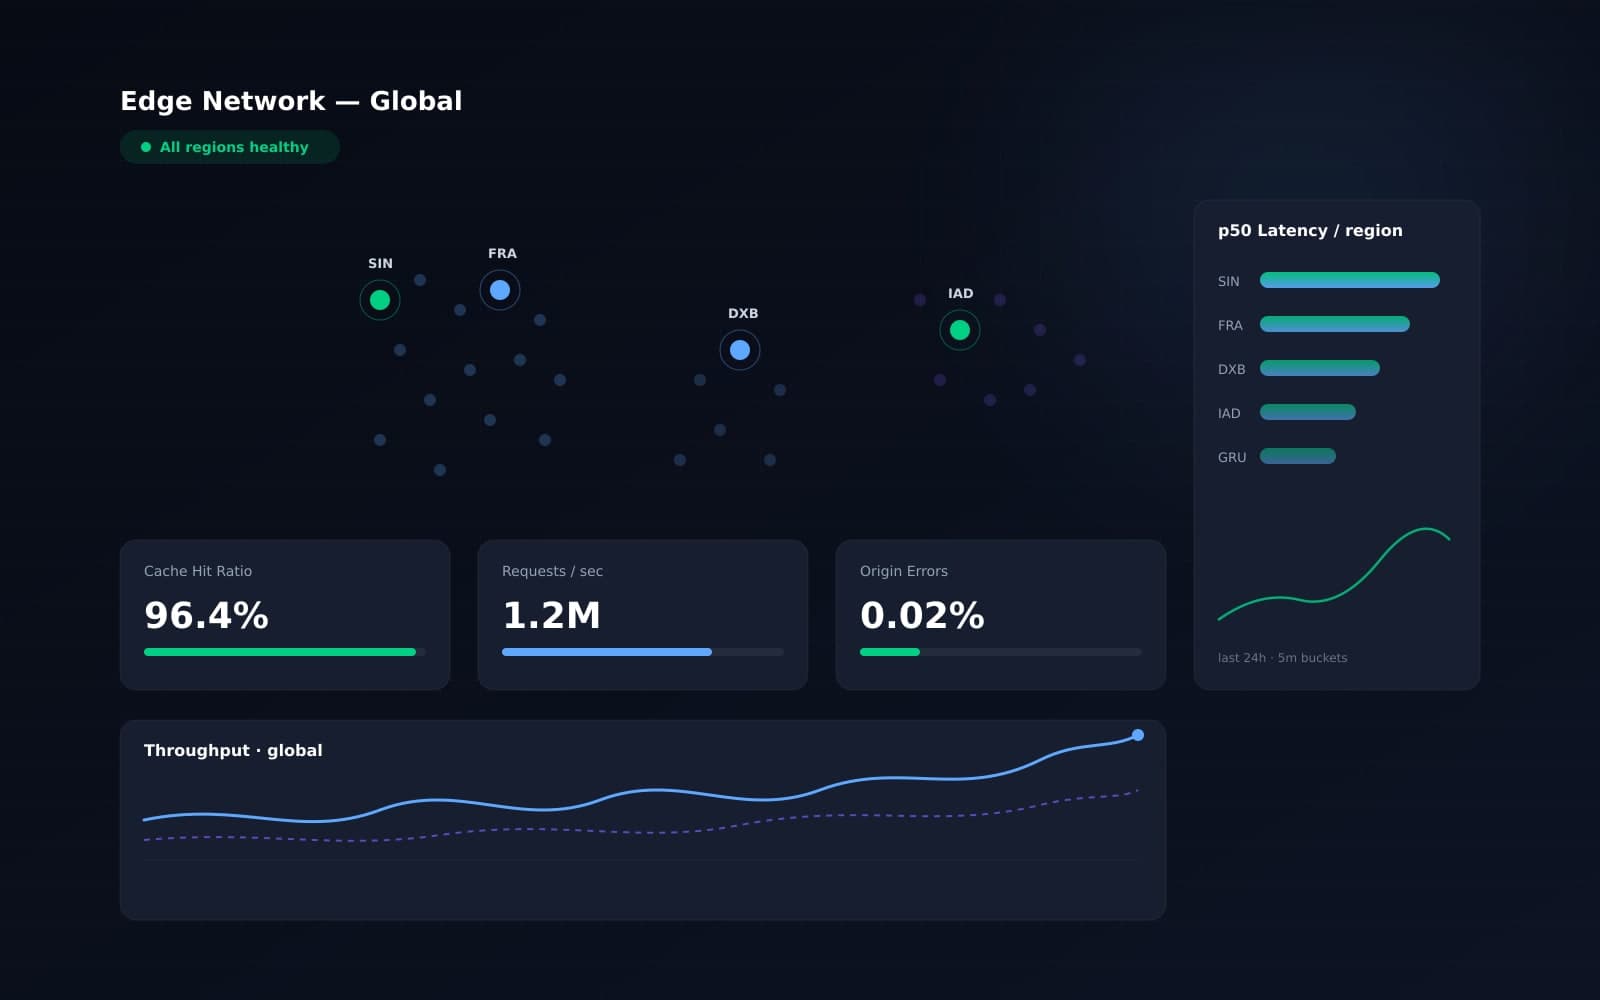
Dashboard
Edge CDN Dashboard
A real-time observability dashboard for a global edge network — cache ratios, origin health, and per-region latency in one view.
Next.jsTypeScriptClickHouseReact Server ComponentsGrafana
Challenge
Ops carried five browser tabs to debug a single incident — one per region — and anomalies were spotted too late.
Approach
A Next.js dashboard reads pre-aggregated telemetry from ClickHouse and streams updates over a persistent connection. Anomaly detection runs on rolling baselines per region; anomalies push to an alerts lane. React Server Components keep the initial render fast.
Outcome
- Single-pane incident view cut mean-time-to-triage by half.
- Alerts fire before user-visible degradation in most cases.
- Dashboard survives a region outage because it is itself edge-served.